Measure True Idle, Cut Fuel Waste: Idle Tracking for Fleet Supervisors

Idle time tracking measures how long a truck or piece of plant sits with the engine running, but not working, so you can turn invisible fuel and maintenance costs into a number you can act on. The fastest way to start is by pairing ignition data with a real engine-run signal through telematics, rather than trusting ignition alone.
TL;DR:
- Tracking engine-run signals with telematics reduces idle fuel consumption by up to 20 percent, saving thousands of gallons weekly for large fleets.
- Accurate idle measurement requires engine RPM or ECM data, not just ignition status, to prevent overestimating idle time.
- Keeping the idle rate below 25 percent aligns with major contractor standards and prevents premature engine servicing and resale value decline.
- Thresholds and real-time alerts help immediate correction, while weekly reviews identify persistent idle offenders for long-term improvements.
- Using idle-adjusted engine hours improves maintenance scheduling, billing accuracy, and asset utilization, especially when integrated into existing fleet management systems.
Table of Contents
- Why tracking idle time matters for your fleet and plant
- How is engine idle time actually measured?
- Key metrics: how to calculate idle rate and idle fuel cost
- Actions that reduce idle time on site
- How idle data improves maintenance, utilisation and billing
- Rolling out idle tracking on site: a practical checklist
- How I’d run the first eight weeks
- Get idle tracking running without the install headache
- Sources
Why tracking idle time matters for your fleet and plant
Non-productive idling typically eats up 10 to 30% of the fuel burned by construction equipment, and most of that time delivers nothing to your bottom line. Telematics-based tracking usually cuts that non-productive idling by 10 to 15%, with some fleets reporting savings closer to 20% once alerts and coaching kick in.
The number that matters: one fleet cut idle fuel use by roughly 20%, saving about 6,000 gallons a week against a 30,000-gallon baseline. Scale that to your own fuel bill and the case for measuring idle writes itself.
The savings go beyond the fuel bill. Idle hours still count toward engine hours, so every idle minute:
- Pushes your asset closer to its next service interval sooner than the work justifies
- Adds hours that erode resale value at trade-in or auction
- Muddies your scheduling data, making it harder to plan crew and machine allocation accurately
Shared telemetry data gives operations, plant managers and finance the same picture. When everyone is arguing from the same idle-rate figure, decisions about fuel budgets, servicing and fleet size stop being guesswork.
How is engine idle time actually measured?
This is where most idle time tracking goes wrong. Ignition-on time is not the same as engine-run time, and a device that only reads ignition status will overstate idle, sometimes badly, because it counts periods when the key is on but the engine hasn’t actually started or has already been shut down.
Accurate measurement needs two signals working together:
- Ignition status, to confirm the key or start switch is on
- RPM or alternator output, to confirm the engine is genuinely running
- ECM or CAN-bus data where available, which gives the cleanest read because it comes straight from the engine’s own control unit
Most aftermarket telematics devices plug into the OBD port or wire directly to the alternator, and installation on a truck or excavator usually takes under an hour per asset once you’ve done a couple. Ignition-only devices misrepresent working time, so if you’re evaluating a device, ask specifically whether it reads engine-run status or just ignition.
Pro Tip: Before rolling out fleet-wide, run a short trial on two or three assets and manually spot-check a handful of idle events against the operator’s own account of the shift. If the numbers don’t match what the operator remembers, the sensor setup needs fixing before you trust the data for coaching or billing.
Key metrics: how to calculate idle rate and idle fuel cost
Two calculations turn raw telematics data into decisions.
- Idle rate = idle hours ÷ total engine hours. If a truck logs 40 idle hours out of 160 engine hours in a week, that’s a 25% idle rate.
- Idle fuel cost = idle litres per hour (LPH) × total idle hours. Find your idle LPH figure in the asset’s operation and maintenance manual, or measure it directly from telematics fuel-sensor data if fitted.
Aim to keep idle rate under 25% as a general fleet target, in line with what major contractors set as their ceiling. Some asset categories, like a static crane on standby, will naturally run higher, so it pays to set separate ceilings per asset type rather than applying one number across the whole fleet.
Actions that reduce idle time on site
Measuring idle is only half the job. The changes that actually move the number are simple, but they need consistency.
Start with rules and escalation triggers:
- Set a hard threshold, for example, idle over three minutes triggers a review, mirroring the 3-minute shutdown rule some fleets already run
- Run a weekly pattern report across the whole fleet, not just single flagged events
- Use real-time long-idle alerts so a supervisor can act the same day, not two weeks later when the report lands
Real-time alerts and weekly reviews do different jobs. Alerts catch the one-off, egregious idle event while a scheduled operator sits stationary with the engine running. Weekly reviews catch the repeat offenders, the truck that idles 40 minutes every morning at the same pickup point, which no single alert will flag on its own.
Beyond alerts, a few operational levers make a real difference:
- Adjust schedule buffers so drivers and operators aren’t sitting idle waiting on the next job
- Tie fuel allocation to rostered working hours rather than a flat weekly amount
- Run a simple incentive for the lowest idle rate by asset category
- Post a visual dashboard in the site office or driver room, since operators change behaviour faster when they can see their own numbers
Pro Tip: Coach on patterns, not single events. Pulling an operator aside over one bad day breeds resentment; showing them their idle trend over four weeks against the fleet average gets buy-in.
How idle data improves maintenance, utilisation and billing
Idle hours count on the hour meter the same as working hours, which means every idle hour brings a service interval forward without producing a cent of billable work. Cutting unnecessary idle hours extends service intervals and helps preserve resale value, often by more than the fuel savings alone.
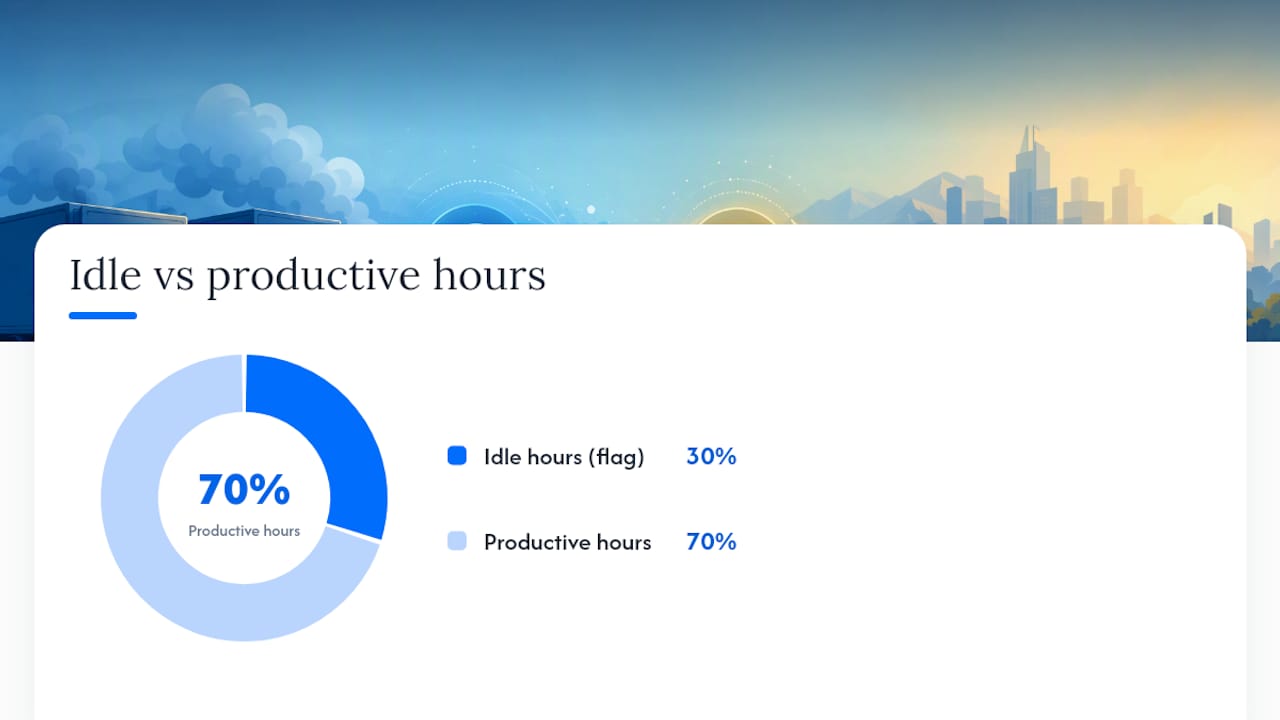
Idle splits are also a fleet-sizing tool. If two graders are running high idle rates on the same site, that’s a strong signal one machine could go back on hire or be reassigned elsewhere rather than sitting there earning nothing. A structured maintenance scheduling approach built on accurate engine-run hours, rather than raw hour-meter totals, keeps preventive servicing on time without over-servicing assets that spend half their day idling.
The same split matters for billing accuracy:
- Use idle-adjusted engine hours when invoicing plant hire, so clients pay for work, not waiting
- Apply the same adjusted figure to internal cost allocation between projects
- Flag any asset where idle hours consistently exceed 30% of total engine hours for a closer look at the job site or the operator’s routine
Rolling out idle tracking on site: a practical checklist
A staged rollout avoids the two most common failures: bad sensor choice and operator pushback.
- Pick the sensor type that reads engine-run status, not just ignition, and confirm it works on your specific make and model before buying fleet-wide.
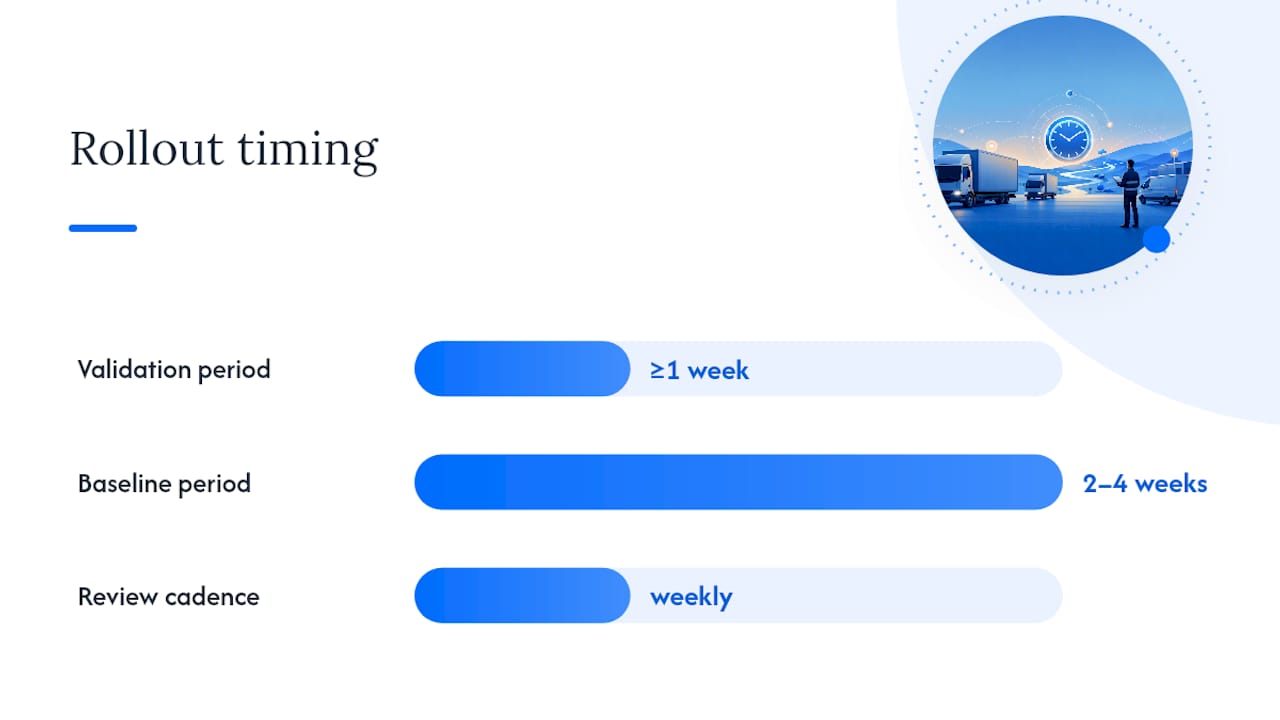
- Install on two to four pilot assets first and validate the RPM or ECM signal against a manual log for at least a week.
- Baseline for two to four weeks before setting any thresholds, so you’re reacting to real data, not a guess.
- Set thresholds and escalation rules, then coach operators on what’s changing and why before the alerts start firing.
- Review weekly and adjust ceilings by asset category as you learn what’s realistic on your sites.
The real value shows up once idle data connects to everything else you’re already tracking. A platform that links idle hours to dockets, GPS location and billing, the way Dirt Champ does, means a supervisor doesn’t have to cross-reference three systems to work out why a truck’s idle rate spiked on a particular job.
Pro Tip: Run your pilot on the noisiest asset in the fleet, not the best-behaved one. If the sensor and thresholds hold up on your worst offender, the rest of the fleet will be straightforward.
How I’d run the first eight weeks
Weeks one and two are baseline and validation only. No alerts, no coaching, just confirming the RPM or ECM signal matches reality against manual spot checks. Weeks three and four introduce alerts on a small trial group and test threshold settings against real shifts. Weeks five to eight scale coaching and any incentive scheme across the fleet, adjusting ceilings by asset category as patterns emerge.
The pitfalls are predictable: choosing a sensor that reads ignition only, skipping operator buy-in and reacting to single bad days instead of trends. Fix the sensor and the trust problem first. Everything else follows.
— Mike
Get idle tracking running without the install headache
Most idle tracking projects stall at the install stage, not the measurement stage. Fleets get quotes for hardwired sensors, complicated wiring jobs, and weeks of downtime before a single asset reports data. Dirt Champ skips that entirely: it pulls GPS and engine-run data through the OBD port with no complex install, then ties that idle data straight to dockets, project records and billing in one platform.
That means a supervisor doesn’t need three separate systems to work out which truck idled 40 minutes at the same site every morning last week. The idle report, the docket, and the billing figure all come from the same data. If you’re ready to see what your fleet’s real idle rate looks like, run a pilot across five to ten assets and check the numbers against your fuel bill. Book a demo of Dirt Champ and get your first idle report within the week.
Sources
- Leveraging machine tech for a win-win-win situation | Construction Business Owner
- Idle time burns the bottom line | Construction Equipment
- What Is Idle Time in Construction Equipment — And How Much Fuel Does It Waste? | Aether IoT (blog)
- How telematics can transform construction fleet management | Equipment Journal