GPS tracking ROI: how fast fleets recover the cost

Most commercial fleets recover the cost of GPS tracking within 3 to 12 months, driven mainly by fuel savings, reduced overtime, and fewer unauthorised trips. Nearly half of fleets report positive ROI inside a year, with the fastest returns going to high-mileage and construction operations. This guide walks through the exact formula, a worked example, and a calculator you can run on your own numbers.
TL;DR:
- High-mileage delivery, construction, and poorly disciplined fleets typically see ROI within two to four months due to immediate fuel and labor savings.
- Properly measuring savings involves calculating full costs, including hardware, subscription, installation, training, and hardware amortization, over the device’s lifespan.
- Fuel, maintenance, and overtime savings appear quickly, with fuel reductions often visible within 30 days, while insurance and other categories may lag several months.
- Verifying ROI requires tracking key metrics at 30, 60, and 90 days from deployment using fuel, payroll, and maintenance data rather than reliance on system summaries.
- Successful ROI achievement depends on diligent staff action on alerts and training, along with accurate baseline data collection before implementation.
Table of Contents
- What ROI benchmarks should you expect from GPS tracking?
- What’s the ROI formula and what should you count?
- Which savings categories actually move the needle?
- How do you build a fleet-specific ROI calculator?
- What does a worked ROI example look like for a small fleet?
- How do you verify ROI is real after deployment?
- How does Dirt Champ support these ROI numbers in practice?
- What do fleet managers usually get wrong about ROI?
- Get your ROI numbers moving with Dirt Champ
- Where these ROI benchmarks come from
- Sources
What ROI benchmarks should you expect from GPS tracking?
Verizon Connect’s 2026 Fleet Technology Trends survey found fleets using GPS tracking cut costs by 11 to 19% across fuel, accidents, labour and maintenance, and that gap has been widening as telematics data gets richer. Some fleets move faster. FleetOpsClub reports payback inside 2 to 4 months for operations where monthly subscription costs are small against recovered fuel and labour savings.
Three fleet types tend to see the quickest returns, as illustrated by HDD tracking for project managers real-time accuracy benefits:
- High-mileage delivery and service fleets, where fuel and route savings compound daily.
- Construction and civil fleets, where idle time and unauthorised equipment use are usually the biggest hidden costs.
- Fleets with poor existing baseline discipline, since there’s more waste to eliminate in the first place.
Fleets with tight routes and disciplined drivers already see less improvement headroom. Payback speed depends heavily on how actively the office team uses the data, not just whether the hardware is installed.
What’s the ROI formula and what should you count?
The standard formula, as Geotracking sets out, is straightforward:
ROI (%) = (Total savings − Total cost) ÷ Total cost × 100
Payback period is simpler still: Total cost ÷ Monthly savings = Months to break even.
The mistake most fleets make is undercounting the cost side. A defensible ROI figure needs every one of these:
- Hardware — trackers, OBD units, or hardwired devices per vehicle.
- Subscription fees — the ongoing per-vehicle monthly cost.
- Installation — labour or contractor time to fit devices.
- Training — hours spent getting drivers and office staff comfortable with the system.
- Integration — connecting tracking data to payroll, dispatch, or compliance software.
- Replacement and amortisation — spread hardware costs over its useful life (typically 3 to 5 years) rather than expensing it all in year one.
Amortising a $150 device over four years, for example, is roughly $37.50 a year per vehicle, not a one-off hit that makes your first-year ROI look worse than it actually is.
Which savings categories actually move the needle?
Break savings into five categories rather than lumping them together. It’s easier to defend the numbers to your accountant, and it’s easier to spot which lever is underperforming.
- Fuel: idle reduction and route optimisation typically deliver the fastest, most visible wins, often inside 30 days.
- Maintenance: GPS-linked diagnostics and scheduled servicing based on actual usage (not guesswork) reduce breakdown-driven repairs.
- Insurance: documented safer driving and reduced claims history can support premium discount conversations at renewal, though this takes a full policy cycle to show up.
- Overtime and labour: accurate time and location data cuts disputed hours and unnecessary overtime approvals.
- Unauthorised use: geo-fence alerts and trip logs catch after-hours or off-route use that quietly drains fuel and wear budgets.
- Productivity: extra completed jobs per day from better dispatching count as a real, if harder to isolate, gain.
LiveViewGPS’s data shows many fleets recoup total tracking costs inside 12 months once these categories are tracked properly rather than estimated.
Pro Tip: Insurance and maintenance savings lag behind fuel and labour savings by months, not weeks. Don’t judge your ROI at 30 days using categories that haven’t had time to materialise yet.
How do you build a fleet-specific ROI calculator?
You need real numbers from your own fleet before you can trust any ROI figure. Vendor case studies are a starting point, not a substitute.
Collect these baseline inputs per vehicle, ideally over 3 months before you deploy anything:
- Monthly fuel spend and average kilometres driven.
- Monthly maintenance and repair spend.
- Current insurance premium and claims history for the past 12 months.
- Overtime hours paid and any disputed time entries.
- Any known or suspected unauthorised use incidents.
Once you have these, multiply monthly figures by 12 to get an annual baseline per vehicle, then multiply by fleet size for a total. Run two scenarios: a conservative model using the low end of benchmark ranges, and an optimistic model using the high end. The gap between them tells you how much your result depends on assumptions versus hard data.
Don’t forget to fold in the amortised device cost and subscription fee from your baseline year. A calculator that ignores implementation costs will always overstate first-year ROI, and that’s the number your finance team will scrutinise hardest.
What does a worked ROI example look like for a small fleet?
Take a 12-vehicle service fleet as an example, using mid-range benchmarks.
- Baseline: $2,200 average monthly fuel spend per vehicle, $180 monthly maintenance, 8 hours monthly overtime per driver at $45/hour.
- Applying savings: a 15% fuel reduction saves $330/vehicle/month; a 10% maintenance reduction saves $18/vehicle/month; cutting overtime by half saves $180/driver/month.
- Per-vehicle monthly savings: roughly $528, or $6,336 annually per vehicle.
- Fleet total: $76,032 annual savings across 12 vehicles.
- Cost side: $150 hardware (amortised at $37.50/year) plus $35/month subscription equals roughly $457/vehicle/year, or $5,484 for the fleet.
Halve the benchmark savings and payback stretches to around 4 months; double them and it compresses toward 6 weeks. Either way, the math clears the cost of the system fast, which matches the 2 to 4 month payback window FleetOpsClub reports across comparable service fleets.
How do you verify ROI is real after deployment?
Set checkpoints at 30, 60, and 90 days rather than waiting for an annual report to tell you whether it worked.
- 30 days: idle time and fuel spend should already show measurable movement, since this is usually the first lever to move.
- 60 days: overtime hours and dispute resolution time should start trending down as location data settles disagreements faster.
- 90 days: compare fuel card statements, payroll reports, and maintenance logs against your baseline to confirm the trend is holding, not a one-off blip.
Pull verification data straight from fuel cards, payroll systems, maintenance records, and insurer statements rather than relying on the tracking platform’s own summary alone. Adjust for seasonal driving patterns and fuel-price swings before you credit or blame the system for a change.
Pro Tip: Report results monthly to whoever owns the budget, not just annually. A stakeholder who sees the trend early is far more likely to back further rollout.
How does Dirt Champ support these ROI numbers in practice?
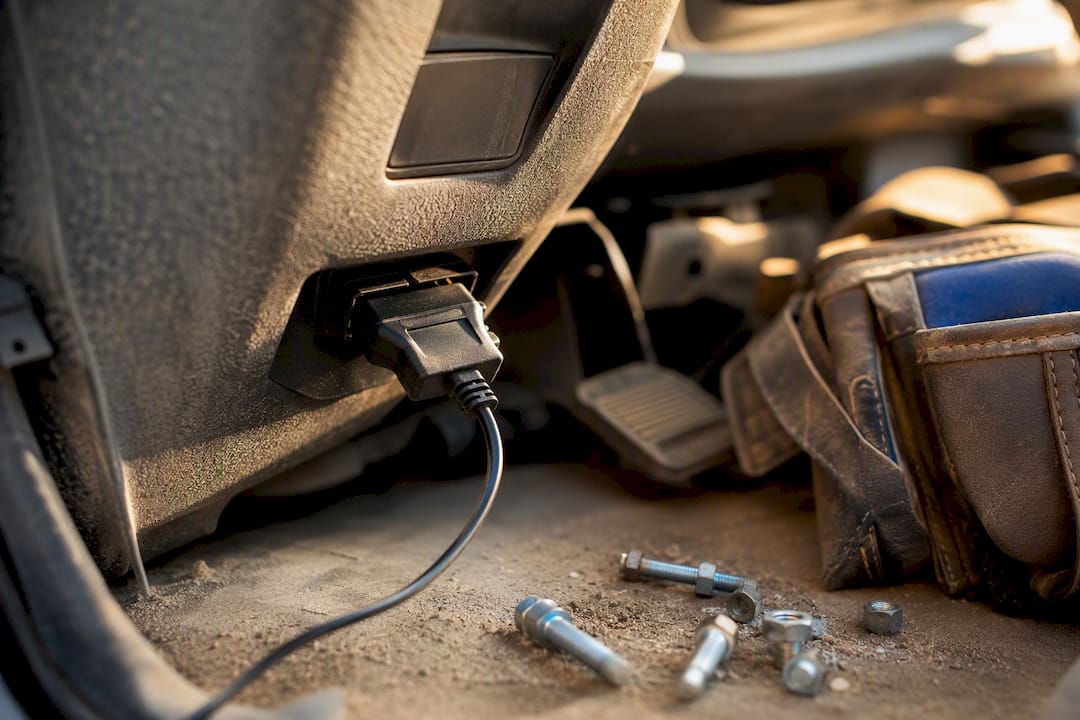
Dirt Champ maps directly onto the savings categories above. Its GPS integration runs through the vehicle’s OBD port without complicated installation, so location and idle data start flowing from day one instead of after a lengthy setup. Automated dockets and pre-starts replace manual paperwork, which is where a lot of the labour and dispute-resolution savings actually come from.
Because every record sits in one platform, exporting fuel, maintenance, and trip data for your own ROI calculator takes minutes rather than a week of chasing paper trails. If you’re building the baseline inputs described above, Dirt Champ’s platform is built to populate them directly.

What do fleet managers usually get wrong about ROI?
Two things separate fleets that hit their ROI projections from those that don’t. First, the tools only pay off when someone actually acts on the alerts, idle reports, and route data every week. Second, savings compound faster when office staff and drivers are trained together, not handed a login and left to figure it out.
Common mistakes that quietly erode realised ROI: skipping the baseline data collection step, judging results too early on slow-moving categories like insurance, treating hardware as a sunk cost instead of amortising it, and never reviewing the numbers after the first month.
— Mike
Get your ROI numbers moving with Dirt Champ
Dirt Champ is the practical way to turn the calculator above into real numbers for your own fleet. GPS tracking plugs in through the OBD port with no complicated install, digital dockets replace the paperwork that eats into labour savings, and every trip, maintenance note, and compliance record sits in one place your office can export straight into a spreadsheet.
If you’re ready to start collecting the baseline fuel, maintenance, and overtime data this article walks through, book a demo with Dirt Champ and see how quickly your own fleet’s numbers stack up.
Where these ROI benchmarks come from
- Verizon Connect’s 2026 Fleet Technology Trends survey — headline cost decrease ranges and 12-month ROI prevalence.
- FleetOpsClub — payback speed examples and the five-category measurement method.
- Geotracking — the ROI formula and total cost of ownership checklist.
- LiveViewGPS — category-specific savings benchmarks and payback data.
Sources
- Verizon Connect 2026 fleet technology trends (summary on Work Truck Online)
- GPS tracking ROI: How fleets measure it (FleetOpsClub)
- How to calculate fleet tracking ROI fast (Geotracking)
- GPS tracking ROI statistics (LiveViewGPS)