Driver behaviour monitoring: what fleet managers need to know
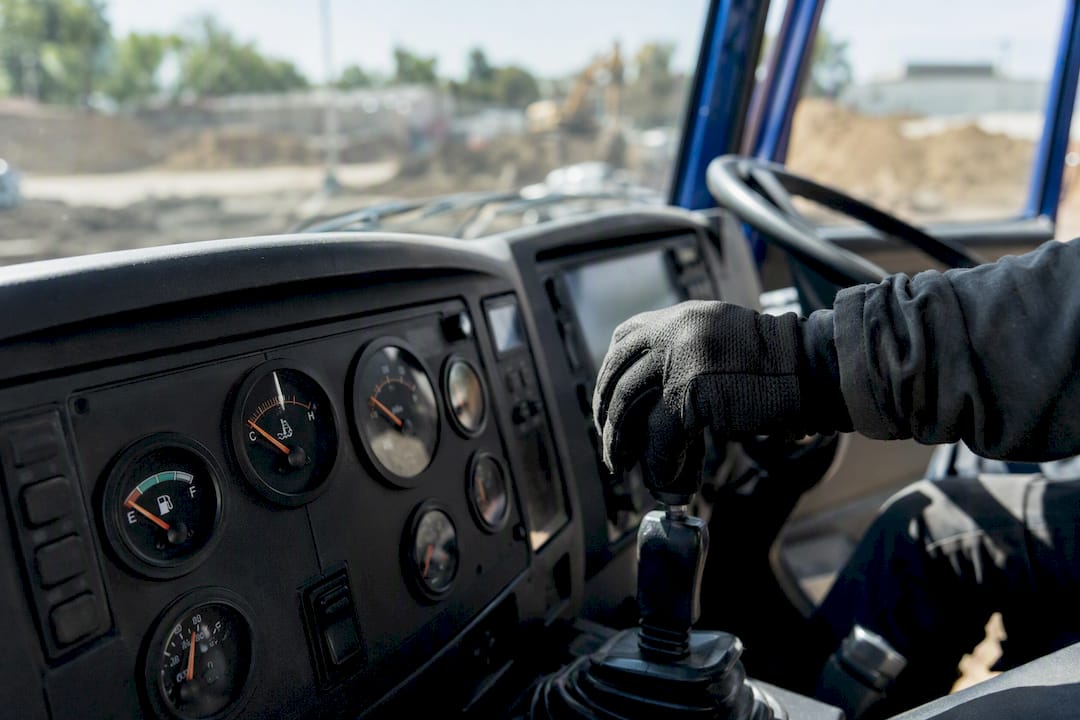
Driver behaviour monitoring gives fleet managers a live, evidence-backed view of how vehicles are actually driven, turning harsh braking events, speeding patterns, and fatigue signals into coaching action. Done properly, it lowers incident rates, cuts fuel and maintenance spend, and gives you defensible evidence for claims. The signals come from telematics (CAN/OBD), GPS, accelerometers, and in-cab cameras; the sections below cover metrics, rollout steps, and how to choose a system.
TL;DR:
- Using CAN bus data for vehicle metrics provides reliable, continuous signals that are less affected by weather and lighting than camera-based systems.
- Layered data processing, including threshold detection, clustering, and machine learning, enables accurate identification of risky driving behaviors with minimal false positives.
- Expect safety and cost reductions to be noticeable after three to six months, with significant fleet-wide impacts emerging beyond six months.
- Effective rollout requires a thorough pilot, clear driver communication, and a defined coaching workflow to prevent resistance and false alerts.
- Systems that integrate field context, like vehicle incidents and site records, enhance the interpretability and actionable value of driver behavior data.
Table of Contents
- What data sources and signals actually matter for driver behaviour monitoring?
- How do systems turn raw signals into coaching-ready findings?
- What safety and cost benefits should you expect, and by when?
- Which metrics belong on a driver scorecard?
- How do you pilot and roll out a monitoring system without a driver revolt?
- What should you look for when comparing systems?
- How field workflows complement behaviour data on real jobs
- Common pitfalls fleet managers should watch for
- Where Dirt Champ fits into your monitoring rollout
- Sources
What data sources and signals actually matter for driver behaviour monitoring?
Every driver behaviour monitoring setup starts with a decision about which signals to trust. Get this wrong and you’ll either drown in useless data or miss the events that matter.
OBD/CAN bus data is the backbone for most fleets. It reports speed, engine RPM, throttle position, brake pressure, and acceleration directly from the vehicle’s own systems, which means it works day and night and doesn’t care about weather or camera glare. A study using CAN bus signals in uncontrolled driving conditions found that a small subset of these signals can reliably cluster drivers by style, without needing every parameter the bus offers.
GPS and trip context add the “where” and “when” to the “what”. Route data, trip duration, and repeat hotspots (that roundabout everyone brakes hard on) turn a raw event count into something a supervisor can actually act on.
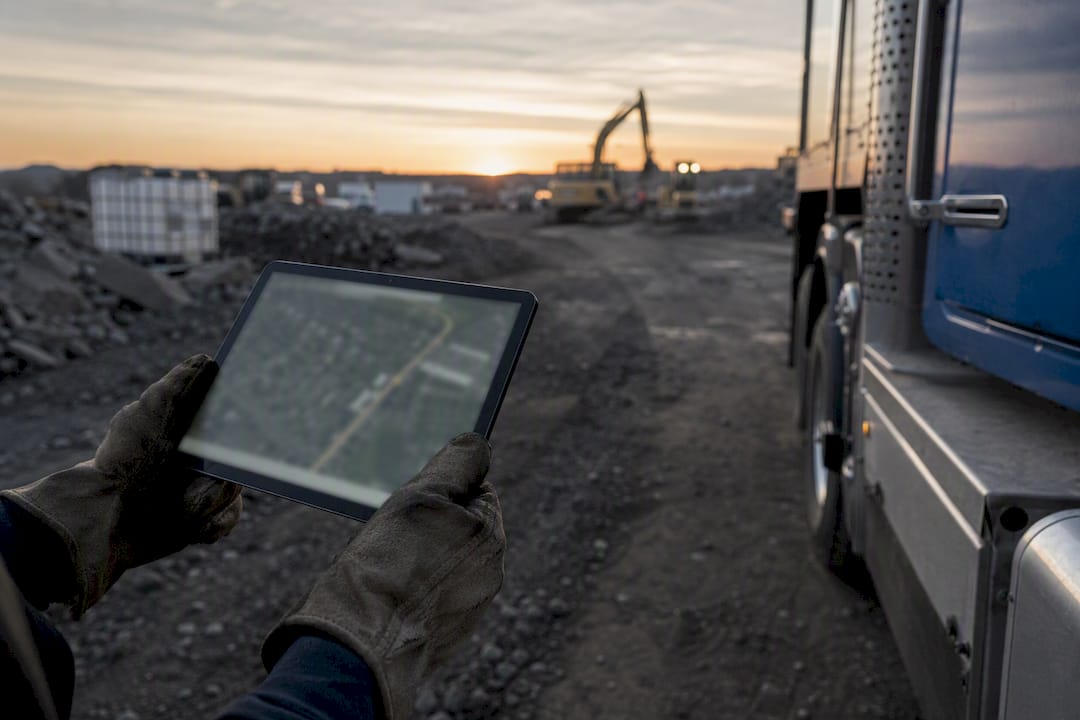
Accelerometer and IMU data catch the physical side of driving: cornering force, jolts, and sudden direction changes that CAN data alone might miss on older vehicles.
In-cab cameras and smartphone sensors detect distraction, drowsiness, and phone use, but they carry real trade-offs:
- Low light and glare degrade detection accuracy
- Occlusion (sunglasses, masks, poor camera angles) causes missed events
- Continuous recording raises privacy and storage concerns drivers will ask about
Data volume reality: Continuous CAN streaming from a mid-size fleet generates far more data than most offices can usefully review. Research on CAN bus subsampling shows that cutting data volume by up to 99% through smart subsampling barely dents clustering accuracy, which is why most serious platforms summarise at the edge rather than streaming everything to the cloud.
How do systems turn raw signals into coaching-ready findings?
Raw telemetry is noise until something processes it. Most driver behaviour monitoring platforms use a layered approach, and understanding the layers helps you interrogate a vendor’s claims rather than just nodding along.
Threshold and event detection is the simplest layer: a brake pressure spike above a set value triggers a “harsh braking” flag. It’s cheap to run and easy to explain to drivers, but it’s blunt. A loaded truck braking hard on a downhill grade looks identical to reckless following distance unless context is added.
Pattern detection and clustering goes further, grouping drivers by overall style rather than single events. This is where the CAN bus clustering work becomes genuinely useful, showing that unsupervised methods can separate driving styles from a handful of well-chosen signals rather than a firehose of raw data.
Machine learning models layer on top to predict risk or classify behaviour, but they come with real failure modes:
- Label scarcity: there’s rarely enough confirmed “this was actually dangerous” data to train on
- False positives: aggressive-looking but legitimate manoeuvres (avoiding a hazard) get flagged as risk
- Drift: a model trained on one route or vehicle type performs worse on another
A survey of visual and vehicular sensor approaches found that fusing camera data with vehicle signals meaningfully reduces false positives compared with either source alone, because vehicular data stays reliable when cameras struggle with lighting or occlusion.
Pro Tip: Ask any vendor how they handle edge versus cloud processing before you sign anything. Edge processing (summarising events on the device) cuts latency and data costs but limits how much raw detail you can retrieve later. Cloud processing gives you richer forensic detail after an incident, at the cost of bandwidth and, often, price.
What safety and cost benefits should you expect, and by when?
The case for driver behaviour monitoring rests on three measurable outcomes: fewer incidents, lower running costs, and better exoneration evidence when something does go wrong.
On safety, research on driver monitoring techniques shows that inattention and drowsiness respond well to real-time detection paired with immediate feedback. That’s a distinct problem from aggressive driving, which tends to respond better to longer-term scorecard trends and coaching conversations than instant alerts.
Operationally, smoother driving (less harsh braking, steadier RPM, fewer rapid accelerations) shows up directly in fuel bills and reduced wear on brakes, tyres, and drivetrains. It also builds a paper trail: when visual and vehicular data are fused, the combined evidence gives claims handlers and insurers the context they need to exonerate a driver quickly, or settle a dispute without a lengthy investigation.
What to expect, realistically:
- Weeks 1 to 4 (pilot): baseline data collection, no behaviour change yet
- Months 3 to 6: measurable drops in harsh-event counts as coaching kicks in
- Beyond 6 months: scaled impact across the fleet, visible in fuel and maintenance spend
Which metrics belong on a driver scorecard?
A scorecard only works if it measures the right things and gets reviewed on a predictable rhythm. Here’s the core set most fleets should track:
- Event counts — harsh braking, harsh acceleration, and speeding events, counted per trip and per period.
- Exposure normalisers — kilometres driven and hours on road, because a driver covering twice the distance will naturally log more raw events.
- Score trend — is this driver’s score improving, flat, or sliding over the past four to eight weeks?
- Repeat hotspots — the same intersection or stretch of road triggering events across multiple drivers points to a road issue, not just a driver issue.
- Coaching closure rate — how many flagged events actually resulted in a documented coaching conversation and follow-up?
On weighting: normalise events against duty cycle before you compare drivers. A tip truck doing constant short urban runs will always show more braking events than a highway linehaul vehicle, and comparing them raw is unfair and demotivating.
Review scorecards weekly for new hires and after any serious event, and fortnightly to monthly for established drivers. The PMC review on driver monitoring is blunt about this: monitoring without an organised coaching workflow and clear ownership of follow-up actions rarely changes behaviour on its own. The scorecard is the trigger, not the outcome.
How do you pilot and roll out a monitoring system without a driver revolt?
A rushed rollout is the fastest way to turn a genuinely useful safety tool into something your drivers resent and route around.
- Design the pilot properly. Pick 10 to 15% of your fleet across different duty cycles (urban, highway, site work), collect two to four weeks of baseline data before you change anything, and run the pilot for at least six to eight weeks. Methodological guidance on driver behaviour studies recommends exactly this: a clear baseline stops you misattributing a seasonal traffic dip or a route change to the monitoring itself.
- Sort hardware and installation early. Confirm OBD port compatibility across your vehicle mix, decide whether cameras are in scope from day one or added later, and check installation time per vehicle so you’re not pulling trucks off the road for a week.
- Get the policy and engagement right before launch. Give drivers a written privacy notice explaining exactly what’s captured and for how long, set fair-use rules in writing, and lead with coaching rather than discipline. Consider a small incentive tied to score improvement, not just compliance.
- Set the operational rhythm. Define alert cadence (real-time for drowsiness, daily digest for speeding trends), assign a named coach to each flagged driver, and document every conversation so patterns are visible six months later.
Pro Tip: Run your pilot on the vehicles with the most variable duty cycles first, not your easiest routes. If the system performs well there, it’ll perform well everywhere else. If you pilot on your cleanest routes, you’ll get a rollout surprise later.
What should you look for when comparing systems?
Skip the feature checklist marketing decks push and focus on criteria that actually determine whether a system earns its keep.
- Signal coverage and data fidelity — does it genuinely capture the CAN/OBD variables relevant to your vehicle types, or just GPS and a rough acceleration guess?
- Interoperability — can it export data or connect via API to your existing fleet management and payroll systems, or does it lock everything inside its own dashboard?
- Data ownership and retention — who owns the footage and telemetry, how long is it kept, and can you get it out if you switch providers?
- Coaching workflow tools — does it just flag events, or does it actually support assigning coaches, tracking closure, and documenting conversations?
- Evidence handling — how are video clips retained and redacted, and is there a sane process for reviewing flagged events rather than treating every alert as gospel?
- Commercial model — per-vehicle subscription, tiered by feature set, or bundled hardware plus software? Model your expected return against claims avoided, fuel savings, and reduced unplanned maintenance, not just the sticker price.
How field workflows complement behaviour data on real jobs
Behaviour data means more with context. Dirt Champ pairs live GPS visibility, tracked via the vehicle’s OBD port with no complex install, with the field records that explain why an event happened.
- Digital pre-starts flag a mechanical issue before it becomes a harsh-braking event
- Dockets and site records show whether a speeding alert happened on a loaded run or empty
- Incident capture ties a behaviour flag directly to a job, site, or customer record
For fleets already juggling compliance paperwork, that context turns a bare scorecard into something a supervisor can act on with confidence.
Common pitfalls fleet managers should watch for
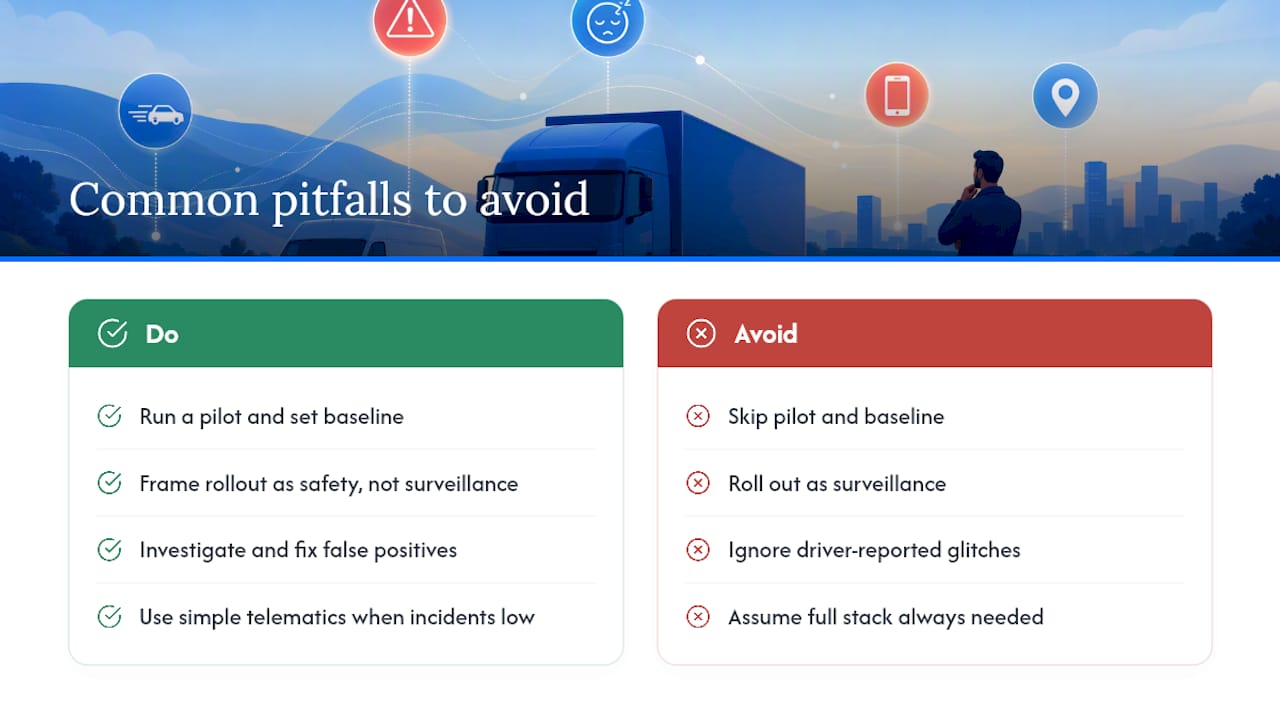
The biggest mistake I see is skipping the pilot and baseline altogether, then blaming the software when the numbers look messy in month one. Weak driver communication is the second: roll this out as surveillance and you’ll get workarounds, not safer driving. Ignoring false positives is the third. If drivers flag genuine glitches and nothing changes, they stop trusting every alert, including the real ones.
Not every fleet needs the full stack, either. If your routes are simple and your incident history is low, a straightforward telematics setup without cameras can deliver most of the value at a fraction of the complexity.
— Mike
Where Dirt Champ fits into your monitoring rollout
If you’re building out driver behaviour monitoring and want the field side of the business connected to it, Dirt Champ gives you live GPS tracking through the vehicle’s OBD port, with none of the complicated installs that usually come with retrofitting a fleet. It sits alongside your monitoring data rather than replacing it, feeding in the pre-starts, dockets, and incident records that turn a bare “harsh braking event” into a documented, explainable one.
That combination matters most in the weeks after your pilot, when you’re trying to work out whether a spike in flagged events is a driver problem or a job-site problem. If you’re ready to see how it fits your fleet, book a demo with Dirt Champ and walk through your own vehicle mix and workflows directly.
Sources
- Methods and tools for monitoring driver’s behavior - PMC
- Driving behavior analysis through CAN bus data in an uncontrolled environment
- Using visual and vehicular sensors for driver behaviour analysis: a survey